In this survey, participants were asked to read a short description of a system (one of the tutorial sections below), and then answer questions about the system’s behavior using one randomly-chosen system artifact:
- a runtime log,
- a log plus an inferred behavioral model (generated using Synoptic),
- or a log plus an inferred performance model (generated using Perfume)
Assignment to evaluate methods of understanding a system's behavior
This assignment takes approximately 60 minutes to complete. All sections are timed -- please allocate an uninterrupted time to complete the assignment. The assignment collects some basic demographic information (e.g., age). Your identity and personal information will never be revealed beyond the research group that created this assignment.
Thank you for participating!Tell us more about yourself
Runtime Logs - Tutorial
This page describes runtime logs, which can be used to understand a system's behavior. At the end of this mini-tutorial, you will answer a few questions to check your understanding of these types of logs.
A runtime log records information about a system and its executions. Each system execution produces a single execution trace, and a log consists of multiple such traces. Each log line in a trace describes an event -- the action the system executed -- and a performance metric that conveys some additional information about the system at the time of the event. In this exercise, a header line at the top of each log will explain the log format.
Consider a simple system that allows clients to log in and after, to read or write data. A runtime log of this system is shown below, including a header line and four distinct execution traces, one per client (each with a unique Client ID). In the log, client a3983's trace (“login→read→logout”) is in bold. The performance metric in this log is the timestamp, in seconds. For example, timestamps associated with a3983's trace indicate that a read event took 4 seconds:
(13010 - 13006 = 4)
13005, a3983, login
13006, a3983, read
13010, a3983, logout
13006, a39830, login
13007, a39830, write
13011, a39830, logout
13008, a201733, login
13009, a201733, read
13011, a201733, logout
13008, a37471, login
13009, a37471, write
13014, a37471, logout
Checking your understanding
The questions below are intended to test your understanding of runtime logs described above. Each question has a single correct answer.
You won't be able to move on until you answer these questions correctly.
Behavioral Models - Tutorial
This page describes behavioral models, which can be used to understand a system's behavior. At the end of this mini-tutorial, you will answer a few questions to check your understanding of this technique.
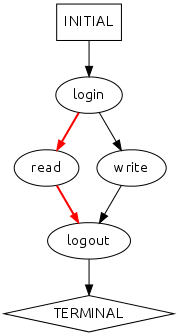
A behavioral model is a graph that describes a system’s behavior. Each node in this graph represents an event: an action the system can take. A path through the model that starts at INITIAL and ends at TERMINAL represents an execution trace: a series of events corresponding to one execution of the system.
The behavioral model below describes two possible executions, one of which is “login→read→logout” (highlighted in red). The absence of a path in a model indicates an invalid execution. For example, there is no “login→logout” path in the model below, so according to the model, the system cannot produce such an execution.
Checking your understanding
The questions below are intended to test your understanding of behavioral models described above. Each question has a single correct answer.
You won't be able to move on until you answer these questions correctly.
Performance Models - Tutorial
This page describes performance models, which can be used to understand a system's behavior. At the end of this mini-tutorial, you will answer a few questions to check your understanding of this technique.
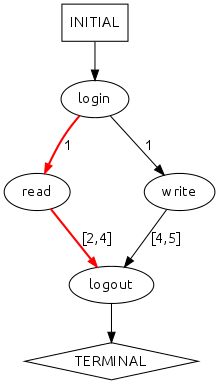
A performance model is a graph that summarizes a system’s behavior. A node in this graph represents an event: an action the system can take, and outgoing edges labeled with performance metrics convey additional information about system performance between the events (e.g., how much time can elapse between the events). A path through the model that starts at INITIAL and ends at TERMINAL represents an execution trace: a series of events corresponding to one execution of the system.
Each node in a performance model is labeled with an event. The edges are labeled with a performance metric, such as, for example, the amount of time that elapses between the two events connected by the edge. Other performance metrics include the number of bytes transferred, bytes written, a measure of power consumed, etc.
In the performance model below, the path “login→1→read→[2,4]→logout” (highlighted in red) indicates that for this execution trace, login takes 1 second, and read takes between 2 and 4 seconds.
Checking your understanding
The questions below are intended to test your understanding of performance models described above. Each question has a single correct answer.
You won't be able to move on until you answer these questions correctly.
Assignment Questions
On this page, you will use a [runtime log / behavioral model / performance model] to answer questions about a simple system.
Connection Tester
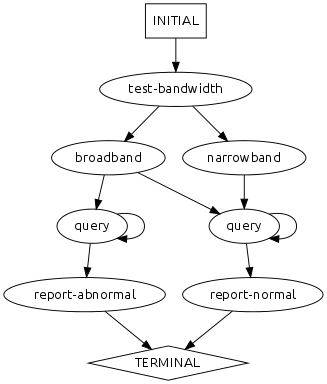
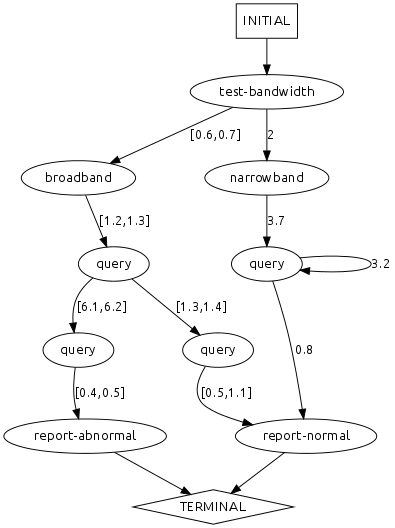
Connection Tester is a tool that diagnoses network issues. It tests a client's bandwidth, executes a series of queries, and then classifies the network path as "normal" or "abnormal" based on the results.
Runtime Log
19.38.218.11 [31/May/2014:31200.0] "GET HTTP/1.1 /test-bandwidth"
19.38.218.11 [31/May/2014:31202.0] "GET HTTP/1.1 /narrowband"
19.38.218.11 [31/May/2014:31205.7] "GET HTTP/1.1 /query"
19.38.218.11 [31/May/2014:31208.9] "GET HTTP/1.1 /query"
19.38.218.11 [31/May/2014:31209.7] "GET HTTP/1.1 /report-normal"
95.39.21.28 [31/May/2014:31200.3] "GET HTTP/1.1 /test-bandwidth"
95.39.21.28 [31/May/2014:31202.3] "GET HTTP/1.1 /narrowband"
95.39.21.28 [31/May/2014:31206.0] "GET HTTP/1.1 /query"
95.39.21.28 [31/May/2014:31206.8] "GET HTTP/1.1 /report-normal"
210.82.199.247 [31/May/2014:31200.1] "GET HTTP/1.1 /test-bandwidth"
210.82.199.247 [31/May/2014:31200.8] "GET HTTP/1.1 /broadband"
210.82.199.247 [31/May/2014:31202.1] "GET HTTP/1.1 /query"
210.82.199.247 [31/May/2014:31208.3] "GET HTTP/1.1 /query"
210.82.199.247 [31/May/2014:31208.8] "GET HTTP/1.1 /report-abnormal"
130.78.242.94 [31/May/2014:31200.1] "GET HTTP/1.1 /test-bandwidth"
130.78.242.94 [31/May/2014:31200.7] "GET HTTP/1.1 /broadband"
130.78.242.94 [31/May/2014:31201.9] "GET HTTP/1.1 /query"
130.78.242.94 [31/May/2014:31208.0] "GET HTTP/1.1 /query"
130.78.242.94 [31/May/2014:31208.4] "GET HTTP/1.1 /report-abnormal"
38.151.1.182 [31/May/2014:31200.2] "GET HTTP/1.1 /test-bandwidth"
38.151.1.182 [31/May/2014:31200.8] "GET HTTP/1.1 /broadband"
38.151.1.182 [31/May/2014:31202.0] "GET HTTP/1.1 /query"
38.151.1.182 [31/May/2014:31203.3] "GET HTTP/1.1 /query"
38.151.1.182 [31/May/2014:31203.8] "GET HTTP/1.1 /report-normal"
37.161.90.108 [31/May/2014:31200.2] "GET HTTP/1.1 /test-bandwidth"
37.161.90.108 [31/May/2014:31200.9] "GET HTTP/1.1 /broadband"
37.161.90.108 [31/May/2014:31202.2] "GET HTTP/1.1 /query"
37.161.90.108 [31/May/2014:31203.6] "GET HTTP/1.1 /query"
37.161.90.108 [31/May/2014:31204.7] "GET HTTP/1.1 /report-normal"
Behavioral Model
Performance Model
System Understanding Questions
Based on the runtime log and behavioral model above, answer the following questions.
Minimum:
Minimum:
Slowest:
Assignment Questions
On this page, you will use a [runtime log / behavioral model / performance model] to answer questions about a simple system.
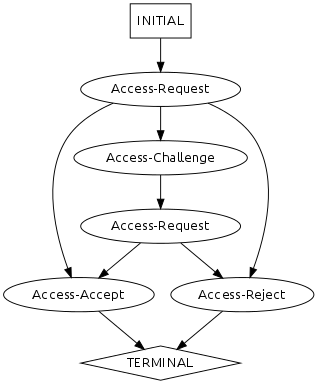
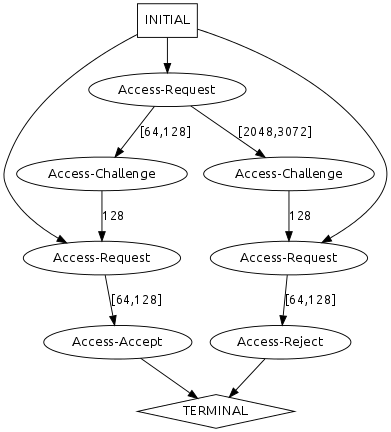
RADIUS Authentication
The RADIUS protocol authenticates clients on a network. To authenticate, a client first sends a username and password in an Access-Request message. The server can respond in three different ways. It can grant the user access with an Access-Accept message, or it can reject access with an Access-Reject message. In either case, authentication ends. Alternatively, the server can request additional credentials with an Access-Challenge message, after which the above steps repeat: the client sends another Access-Request message, and the server again responds.
In the following log, Total bytes transferred represents the number of bytes communicated in either direction before the current message is sent.
Runtime Log
0, 122.88.9.104, Access-Request
64, 122.88.9.104, Access-Accept
0, 102.24.169.15, Access-Request
128, 102.24.169.15, Access-Accept
0, 37.161.90.108, Access-Request
64, 37.161.90.108, Access-Reject
0, 91.83.112.9, Access-Request
96, 91.83.112.9, Access-Reject
0, 237.79.201.32, Access-Request
2048, 237.79.201.32, Access-Challenge
2144, 237.79.201.32, Access-Request
2208, 237.79.201.32, Access-Reject
0, 212.5.97.41, Access-Request
3072, 212.5.97.41, Access-Challenge
3184, 212.5.97.41, Access-Request
3312, 212.5.97.41, Access-Reject
0, 187.154.73.224, Access-Request
64, 187.154.73.224, Access-Challenge
192, 187.154.73.224, Access-Request
320, 187.154.73.224, Access-Accept
0, 46.8.192.199, Access-Request
128, 46.8.192.199, Access-Challenge
256, 46.8.192.199, Access-Request
352, 46.8.192.199, Access-Accept
Behavioral Model
Performance Model
System Understanding Questions
Based on the runtime log above, answer the following questions.
Smallest:
Minimum:
Minimum:
Assignment Questions
On this page, you will use a [runtime log / behavioral model / performance model] to answer questions about a simple system.
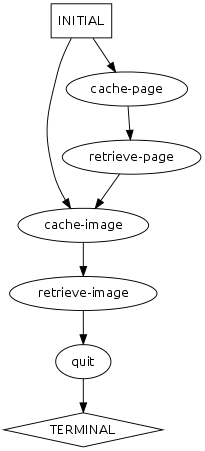
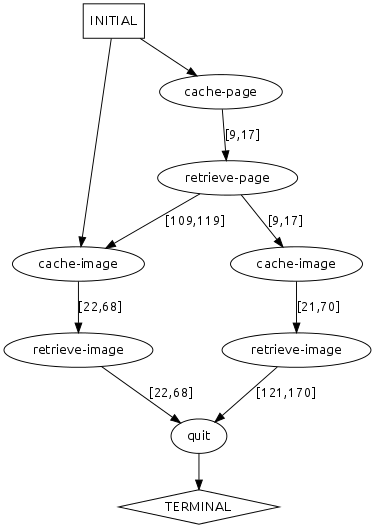
Caching Web Browser
Web browsers often cache previously-viewed pages and resources to disk so that subsequent requests to the same pages are faster. A browser might record when it caches a page to disk (cache-page), retrieves a page from disk (retrieve-page), caches an image to disk (cache-image), and retrieves an image from disk (retrieve-image). The log/model below represents captured traces for such caching and retrieving events along with the total number of KB read from and written to disk.
In the following log, Total KB transferred represents the number of KB read/written in either direction before the current event.
Runtime Log
164.163.76.74, cache-page, 0
164.163.76.74, retrieve-page, 9
164.163.76.74, cache-image, 18
164.163.76.74, retrieve-image, 39
164.163.76.74, quit, 160
237.250.28.190, cache-page, 0
237.250.28.190, retrieve-page, 17
237.250.28.190, cache-image, 34
237.250.28.190, retrieve-image, 104
237.250.28.190, quit, 274
130.78.242.94, cache-page, 0
130.78.242.94, retrieve-page, 9
130.78.242.94, cache-image, 118
130.78.242.94, retrieve-image, 140
130.78.242.94, quit, 162
177.176.181.25, cache-page, 0
177.176.181.25, retrieve-page, 17
177.176.181.25, cache-image, 136
177.176.181.25, retrieve-image, 204
177.176.181.25, quit, 272
195.88.181.89, cache-image, 0
195.88.181.89, retrieve-image, 27
195.88.181.89, quit, 54
153.98.187.29, cache-image, 0
153.98.187.29, retrieve-image, 62
153.98.187.29, quit, 124
Behavioral Model
Performance Model
System Understanding Questions
Based on the runtime log and performance model above, answer the following questions.
Minimum:
Before you go...
Please explain your experiences with logs, behavioral models, and performance models. Thank you!
Thank you!
You have successfully completed the assignment.